Gapminder

Gapminder allows us to gain insight about several social-economic factors such as life expectancy and GDP per capita for all countries around the globe. It is also meaningful to find out if there are correlations between these factors to understand the overall trend and make better decisions in the future.
Relationship between HIV Infection and Life Expectancy
  exp_hiv_worldbank %>%
  filter(!is.na(Life_Expectancy)) %>%
  ggplot(aes(x = Infection_Rate,
             y = Life_Expectancy))+
  geom_point(na.rm = TRUE, col = "black", cex = 0.5, alpha = 0.5)+
  facet_wrap(~region, ncol=3,nrow=3, scales = "free_x")+
  geom_smooth(method = "lm", na.rm = TRUE )+
  theme_igray()+
  labs(title = "Life Expectancy Likely Decreases with HIV Prevalence across Regions",
       subtitle = "Sub-Saharan Africa and Latin America exhihit high HIV Infections",
       x = "Infection Rate",
       y = "Life Expectancy")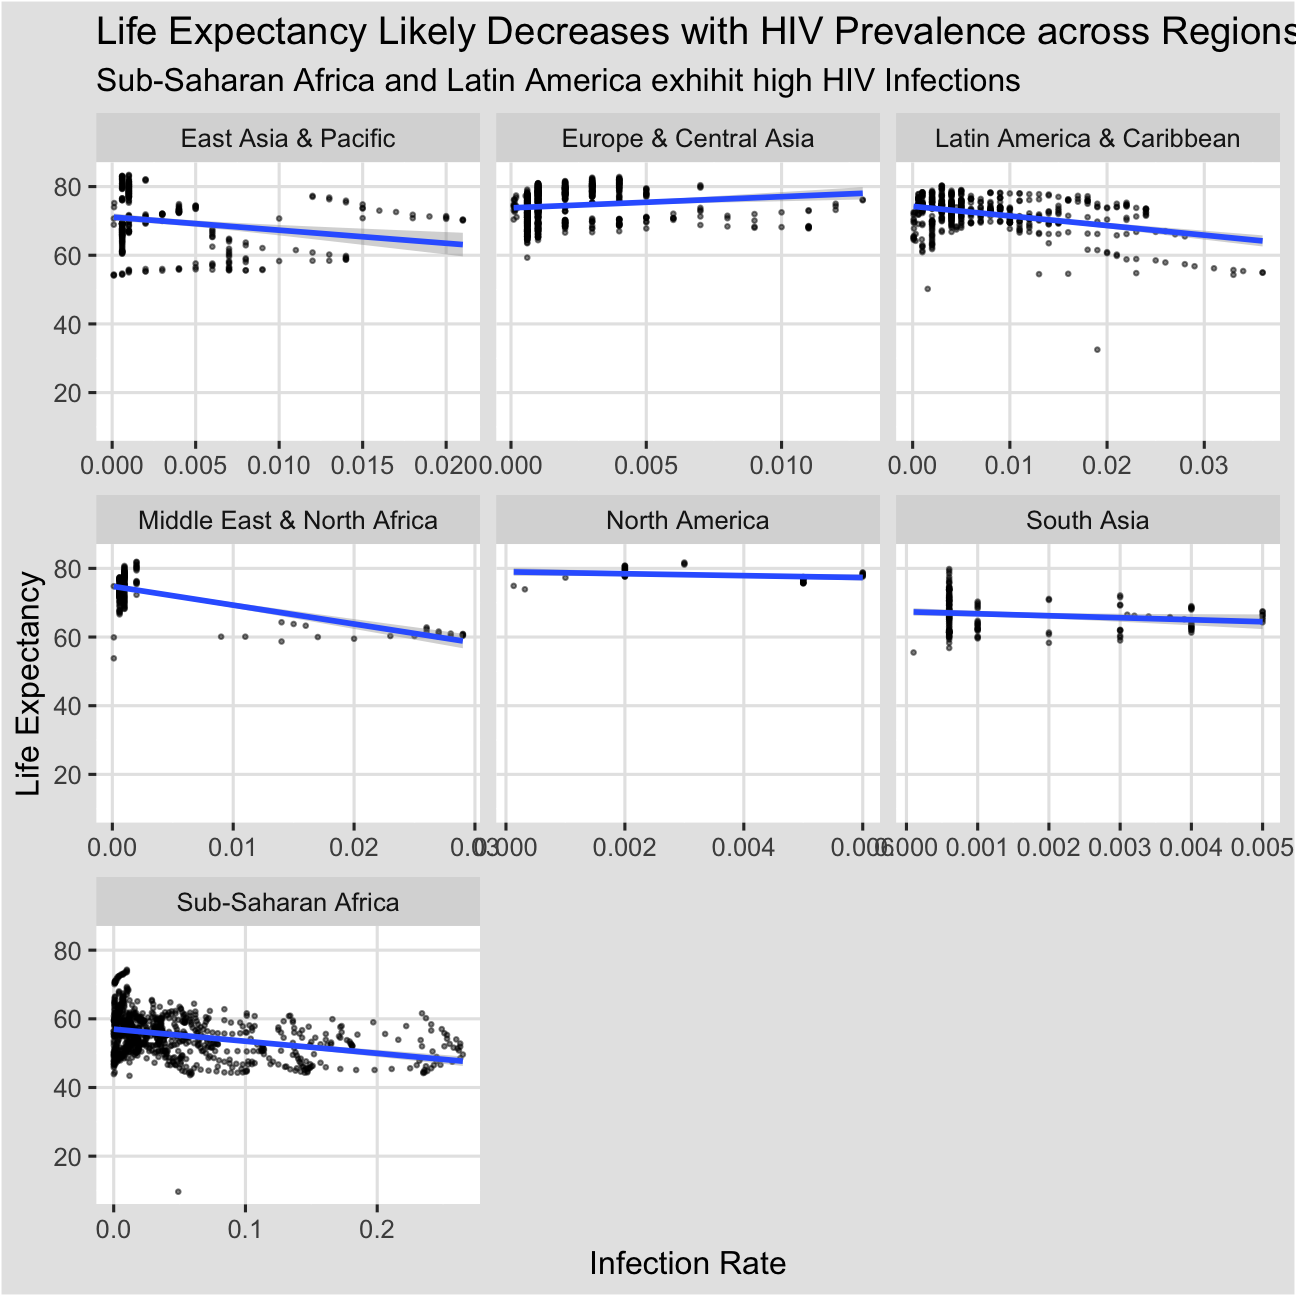
The life expectancy and HIV prevalence have negative relationships in all regions around the globe. However, the relationship is most prominent in Sub-Saharan Africa and it has much higher HIV infection rates than other regions.
Relationship between Fertility Rate and GDP per Capita
  exp_hiv_worldbank %>%
  filter(!is.na(region)) %>%
  ggplot(aes(x= Fertility_Rate,
             y = GDP_per_Capita))+
  geom_point(na.rm = TRUE, col = "black", cex = 0.5, alpha = 0.5)+
  facet_wrap(~region, ncol=3,nrow=3, scales = "free_y")+
  geom_smooth(method = "auto", na.rm = TRUE )+
  theme_igray()+
  labs(title = "GDP per Capita likely Decreases with Fertility Rates across Regions",
       subtitle = "GDP per Capita have large variations within regions, however",
       x = "Fertility Rate",
       y = "GDP per Capita")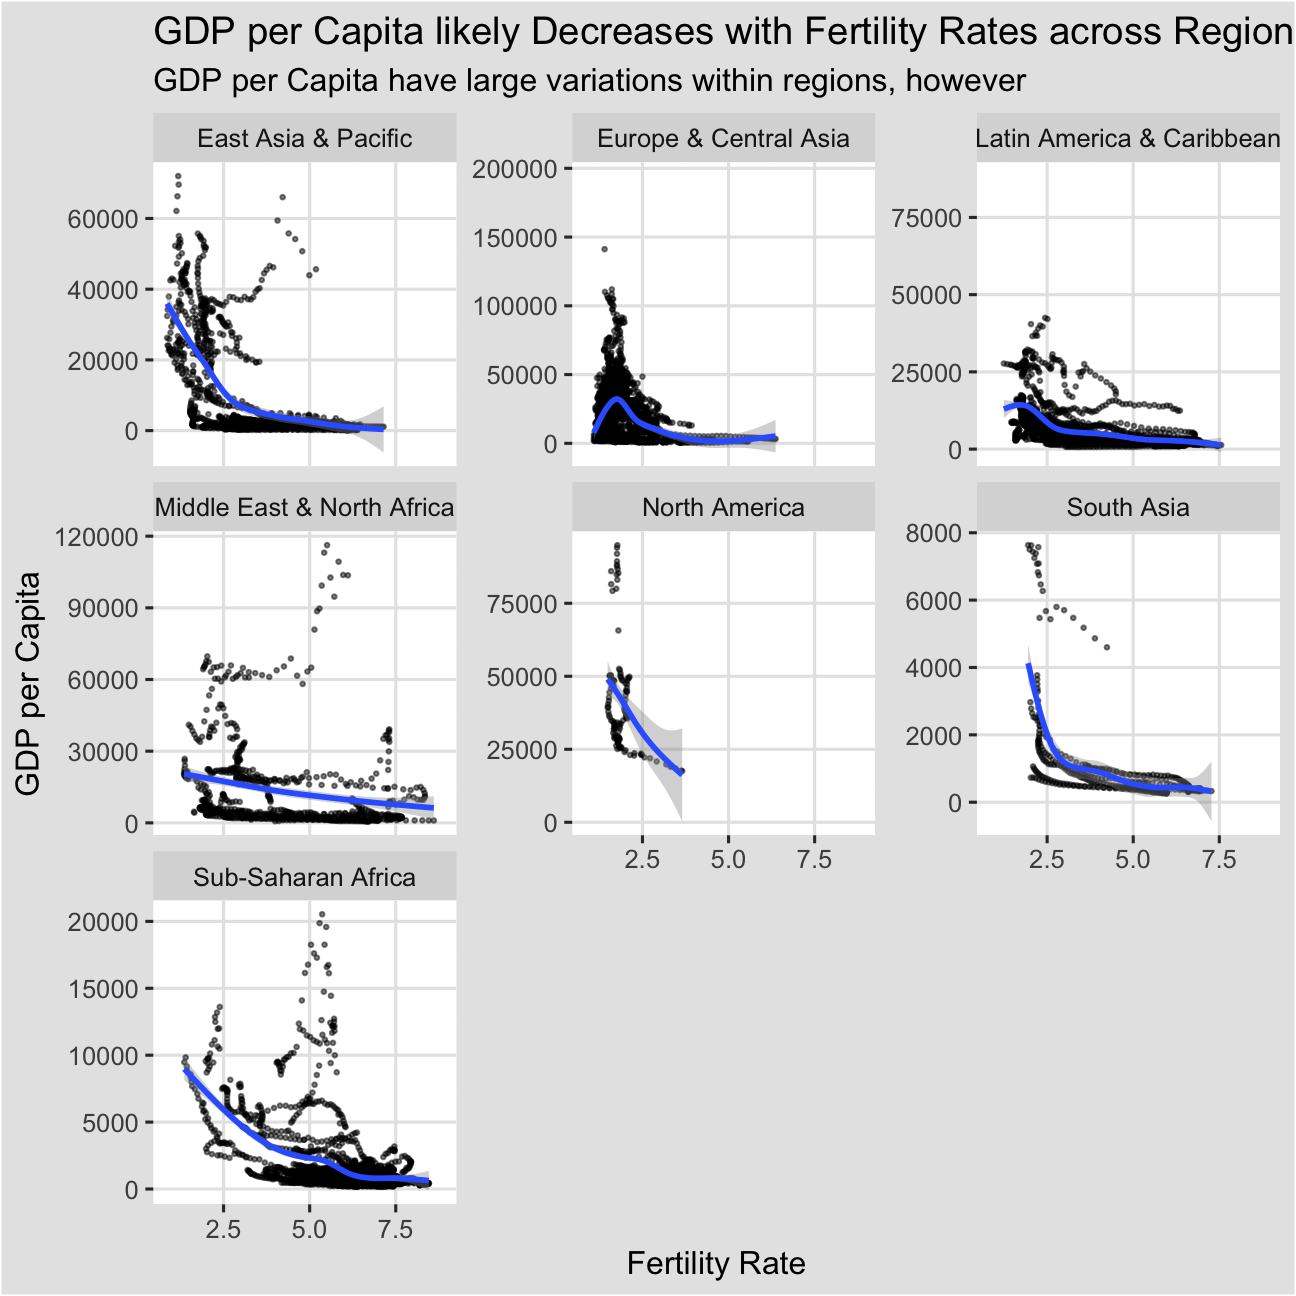
We can observe from the graphs that GDP per Capita generally decreases with fertility rate, with a few exceptions in Europe & Central Asia, where in the lower end of fertility rates tend to contribute to a higher GDP per Capita. This is likely due to the fact that many European countries have problems with aging societies, so their GDP per capita might increase with higher fertility rates to boost economic production. The overall negative relationship could be explained by the fact that with a fixed amount of GDP, GDP per capita and population are inversely related, so countries with low fertility rates tend to have less population and therefore higher GDP per Capita.
Change in Mortality Rates by Regions
exp_hiv_worldbank %>%
  filter(!is.na(region)) %>%
  ggplot(aes(x= Year,
             y = Mortality_Rate))+
  geom_point(na.rm = TRUE, col = "black", cex = 0.5, alpha = 0.5)+
  facet_wrap(~region, ncol=3,nrow=3, scales = "free_y")+
  geom_smooth(method = "auto", na.rm = TRUE )+
  theme_igray()+
  labs(title = "Mortality Decreased Over the Years in All Regions",
       subtitle = "North America sees the fastest improvement",
       x = "Year",
       y = "Mortality Rate")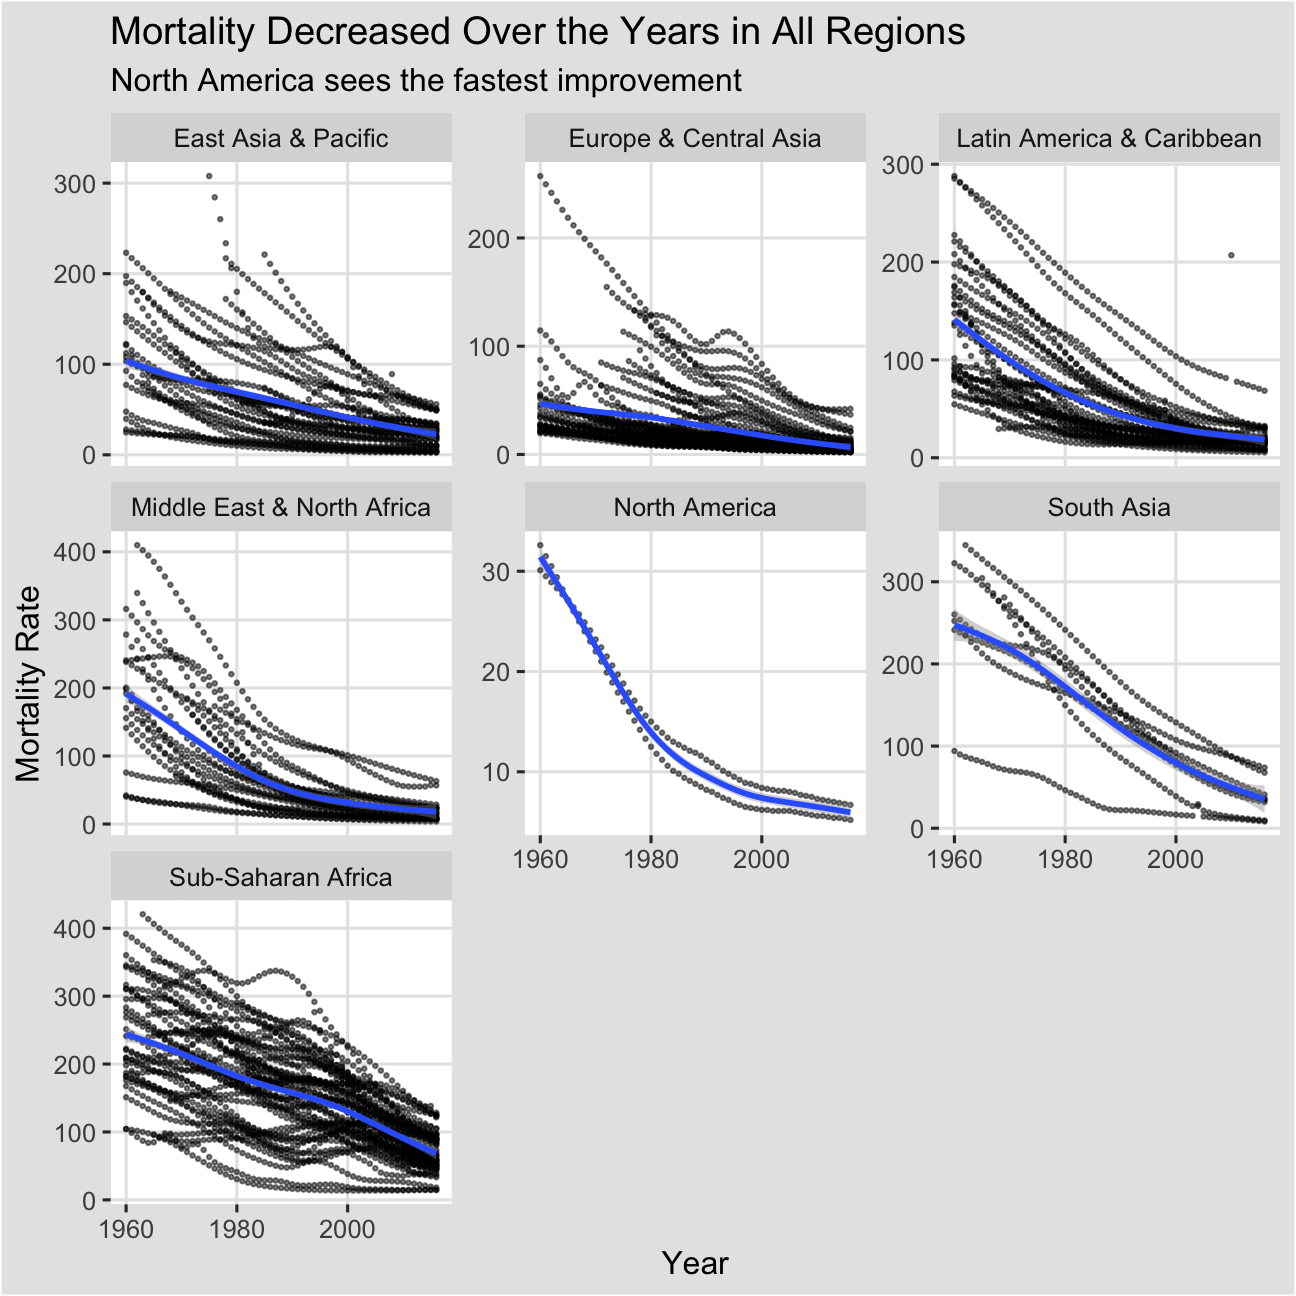
The mortality rate has improved(decreased) across all regions from 1960 to 2016. North America sees the greatest improvement, although its mortality rate was very low in 1960 compared to other regions.
Relationship Between School Enrollment and Fertility Rate
  exp_hiv_worldbank %>%
  filter(!is.na(region)) %>%
  ggplot(aes(x= School_Enrollment,
             y = Fertility_Rate))+
  geom_point(na.rm = TRUE, col = "black", cex = 0.5, alpha = 0.5)+
  facet_wrap(~region, ncol=3,nrow=3, scales = "free_x")+
  geom_smooth(method = "lm", na.rm = TRUE )+
  theme_igray()+
  labs(title = "There is a Relatively Negative Relationship Between School Enrollment and Fertility Rate",
       subtitle = "The Relationship is Less Prominent in Europe and Central Asia",
       x = "School Enrollment",
       y = "Fertility Rate")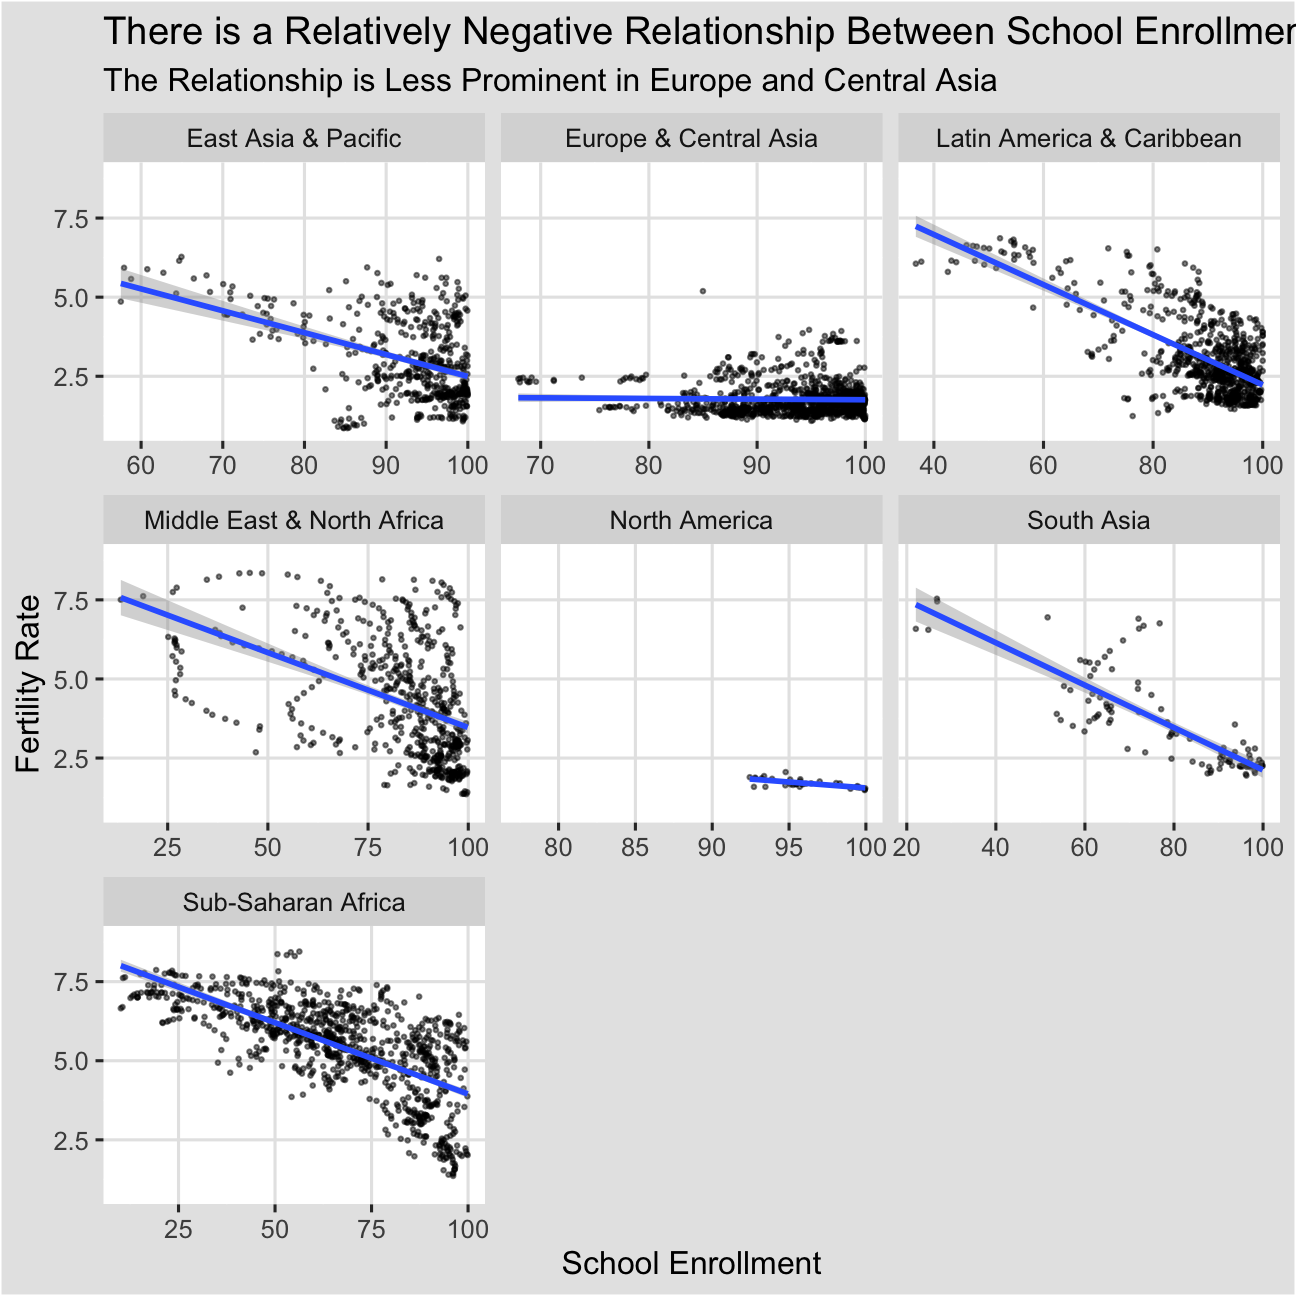
We can observe from the graphs that fertility rate and school enrollment are somewhat negatively related. However, it is less prominent in the Europe and Central Asia region as well as North America, possibly due to the fact that these regions consists of many developed countries where fertility rates are generally low and people can better afford education for children. For the rest of the regions, the negative relationship can be explained by the financial burden associated with more children, so a smaller proportion of them can attend primary schools.